Screenshots
News
License
Download
Project at Sourceforge

|
With TickVue you can track the stock market in nearly real-time. It
queries Yahoo Finance periodically, updates the stock values you are
interested in and calculates your portfolio value and daily gain.
Features
-
Real-time stock and portfolio tracker. Updates tickers and overall stock portfolio values every 30 seconds.
- Display charts of selected tickers so you can easily assess their performance.
Discreetly minimizes to the system tray. You do not even
need to restore the window application in order to know how your
portfolio and chosen symbols are performing.
-
Multi-platform. Runs in Windows, Mac, Linux and (theoretically) any other Qt-compatible system.
- Free and open source.
Screenshots
When you run TickVue for the first time you will see its main window showing a blank table like the one below.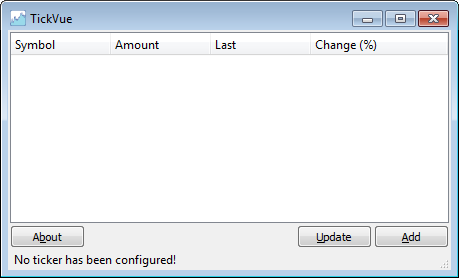
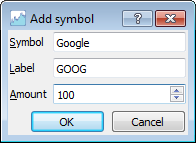
All you have to do is add symbols that belong to your portfolio. Here you are adding 100 Google stocks to your portfolio.
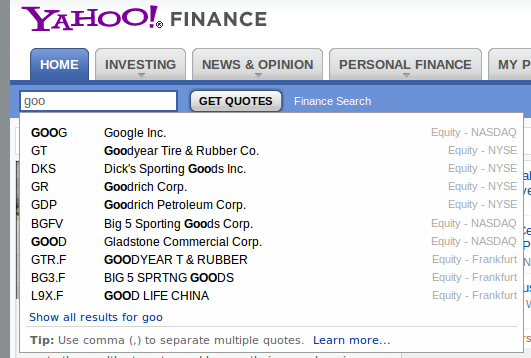
In case you are not sure what is the label that you must use
for the ticker you are intereseted in, go to Yahoo Finance and start
typing the company name in order to have a hint from the site.
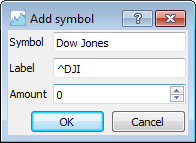
You want to track Dow Jones value while the market is open: just set its amount to 0.
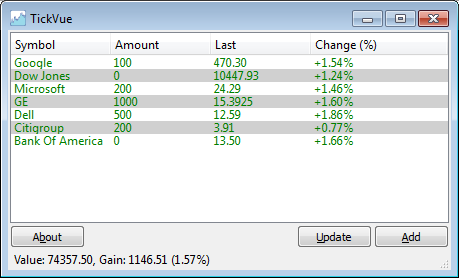
Main window after everything is setup. You own Google,
Microsoft, GE, Dell and Citigroup stocks. You want to track Dow Jones
and Bank of America. The status bar shows your portfolio value and daily gain.
You can select some of the symbols. When you do that the
status bar will change its contents in order to reflect the value and
daily gain of the selected symbols only. In the picture below you have
selected Google, Microsoft and Dell.
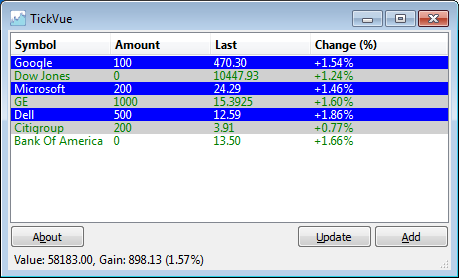
Hint: press ESC to unselect all the symbols.
A context menu will show up after you right click a symbol.
It gives you options to either delete or edit the ticker. You also have
options to investigate charts that show the way the symbol value
changed with time.
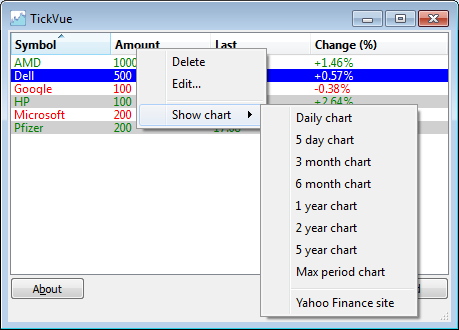
Hints: press DEL to delete a symbol. Double click a symbol in order to edit it.
The screenshot below shows you the window that pops up after you select the daily chart for one of the symbols.
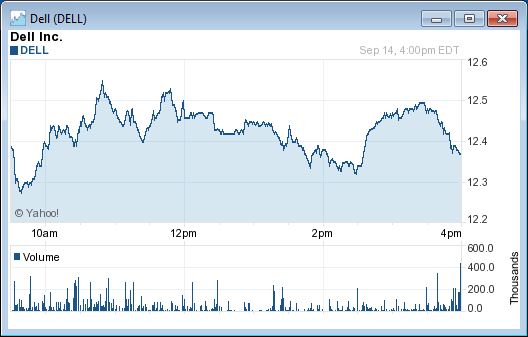
If more than one symbol is selected then you will see a chart which shows the relative performance of the selected symbols.

When you close TickVue's main window, the software minimizes itself to the
system tray and shows an icon which may be either green or red. TickVue
gives you a summary of your portfolio as well as the values of the
tracked symbols if you rest the mouse pointer over the icon.
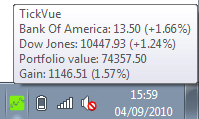
Hint:
the icon color is given by the performance of the first symbol in
alphabetical order whose amount is 0. If you have no symbol in that
condition, the color will be given by the overall portfolio performance.
News
Oct 30th, 2010
Release 0.13.05 submitted to Sourceforge.
Changes:
1. TickVue now shows the following information inside tooltips: last update date and time, absolute ticker change, and volume.
2. Daily and 5-day charts are automatically updated every 2 minutes.
3. Bug fix: the gain indication at the status bar used to have a
residual error. That was because the gain was calculated from the
percent gain of each stock rather from their absolute gains.
Oct 2nd, 2010
Release 0.12.02 submitted to Sourceforge.
Changes:
1. The symbol context menu has been implemented.
2. Charts.
Sep 6th, 2010
Release 0.11.01 submitted to Sourceforge.
Changes:
1. New icons.
2. Configuration is saved as soon as it changes, so it is not lost in case of an unexpected program termination.
3. System tray icon context menu now has a "Restore" option.
4. Symbol selection now shows the selected items in blue.
5. TickVue shows its main window after start if there is no configuration.
6. Status bar and system tray tooltip do not indicate timeout when no ticker has been configured.
Aug 21th, 2010
Release 0.10.03 submitted to Sourceforge.
|


